Bubbleplot in R
Bubbleplot
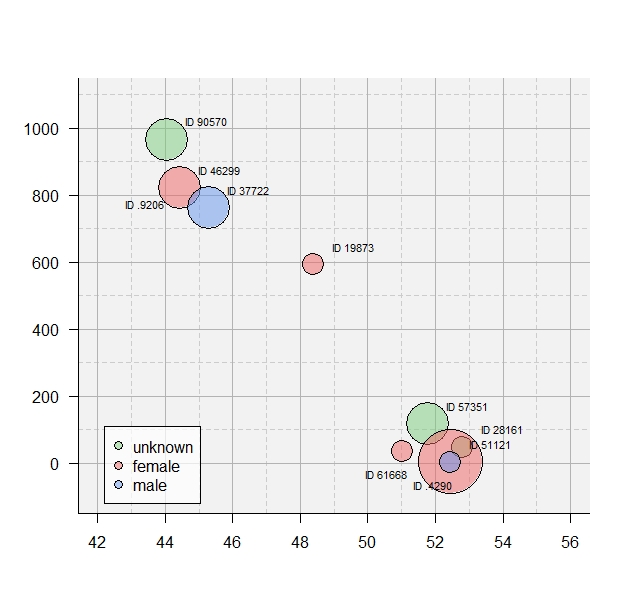
The bubbleplot is an extension of the scatterplot. Transparent colours and different sizes in dependence of other variables make the scatterplot a bubbleplot. Thus, to create a bubblelplot we also use the plot()-function.
As in any other plot legends and labels can be added easily.
This graphic was created using the following code:
fal <- structure(list(ID = c("ID 46299", "ID 94182", "ID 69382", "ID 36171",
"ID 07161", "ID 16704", "ID 32346", "ID 14076", "ID 25095", "ID 30021"
), Latitude = c(44.41666, 52.35, 52.26666, 53.11666, 52.85, 52.23333,
51.36666, 51.05777, 52.53642, 52.66666), Distance = c(823L, 209L,
108L, 98L, 96L, 50L, 15L, 14L, 5L, 0L), Sex = structure(c(2L,
3L, 1L, 2L, 2L, 1L, 3L, 2L, 3L, 3L), .Label = c("-", "F", "M"
), class = "factor"), Age = c(2L, 4L, 1L, 3L, 1L, 1L, 4L, 6L,
5L, 1L)), class = "data.frame", row.names = c(1058L, 1536L, 1469L,
1309L, 1545L, 35L, 881L, 870L, 374L, 1410L))

fal$pos = c(4, 1, 4, 4, 4, 4, 4, 1, 4, 1)
x <- ifelse(fal$pos==4, fal$Latitude + 0.5, fal$Latitude - 0.5)
y <- ifelse(fal$pos==4, fal$Distance + 50, fal$Distance - 50)

plot(1, 1, xlim = c(42, 56), ylim = c(-100, 1100), axes = FALSE, xlab = "", ylab = "")
rect(par("usr")[1], par("usr")[3], par("usr")[2], par("usr")[4], col = "grey95", border = NA)
for(i in seq(43, 57, 2)) abline(v = i, col = "grey80", lty = 2)
for(i in seq(100, 1100, 200)) abline(h = i, col = "grey80", lty = 2)
for(i in seq(42, 56, 2)) abline(v = i, col = "grey70")
for(i in seq(0, 1000, 200)) abline(h = i, col = "grey70")
par(new = TRUE)
plot(fal$Latitude, fal$Distance, pch = 21, bg = c(adjustcolor("palegreen3", 0.5), adjustcolor("indianred2", 0.5),
   adjustcolor("cornflowerblue", 0.5))[factor(fal$Sex)], cex =c (3, 6, 9)[factor(fal$Age)], xlim = c(42, 56), ylim = c(-100, 1100),
   las = 1, xlab = "", ylab = "", bty = "l")
text(x, y, fal$ID, pos = fal$pos, offset = c(0, 0.1, 0.3, 0.4)[factor(fal$ALTER)], cex = 0.7)
legend(42.2, 110, c("unknown", "female", "male"), pch = 21, pt.bg = c(adjustcolor("palegreen3", 0.5), adjustcolor("indianred2", 0.5),
   adjustcolor("cornflowerblue", 0.5)), bg = adjustcolor("white", 0.7), pt.cex = 1.3)
Tags
Bubbleplot, different colours, transparency, background colour, dependent size, dependent colours, box, x-axis, y-axis, bottom, left, top, right, labels, without ggplot